Open the Dashboard
If you followed the Quickstart, the dashboard is already running. Open http://localhost:8000 in your browser. You should see an empty state — this is expected before any controls are created.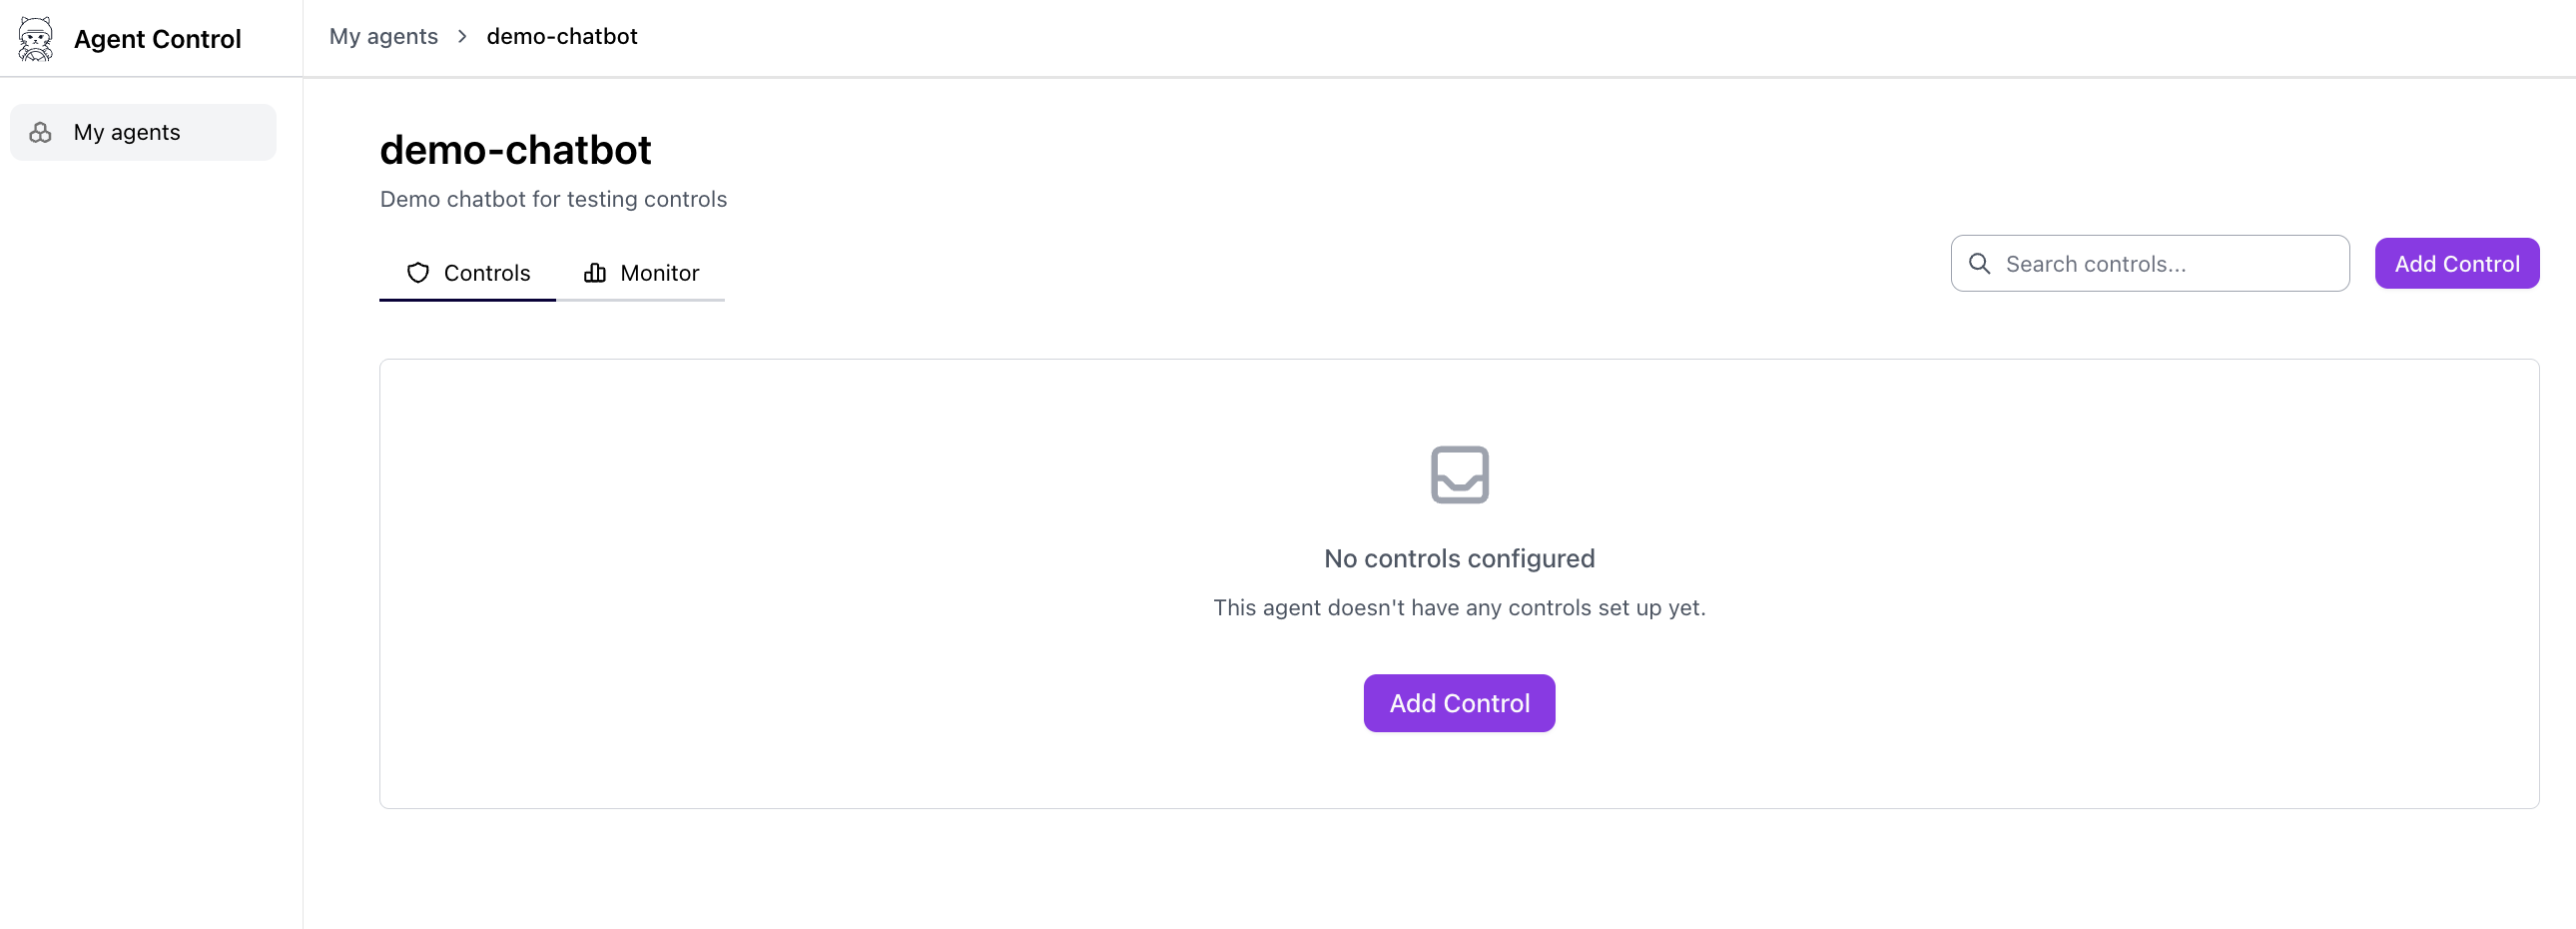
Manual setup (only if you're running the server from source)
Manual setup (only if you're running the server from source)
If you cloned the The dashboard will be running at http://localhost:4000.
agent-control repository and started the server with make server-run, you need to start the UI separately:Prerequisites:- Node.js 20+ (CI uses 20; 18+ may work)
- pnpm 9+ — install from pnpm.io or run
corepack enable && corepack prepare pnpm@latest --activate
Create Controls from the UI
You can create controls directly in the dashboard — no scripts or SDK code required.1
Add a new control
Click the Add Control button from the controls page to start creating a new control.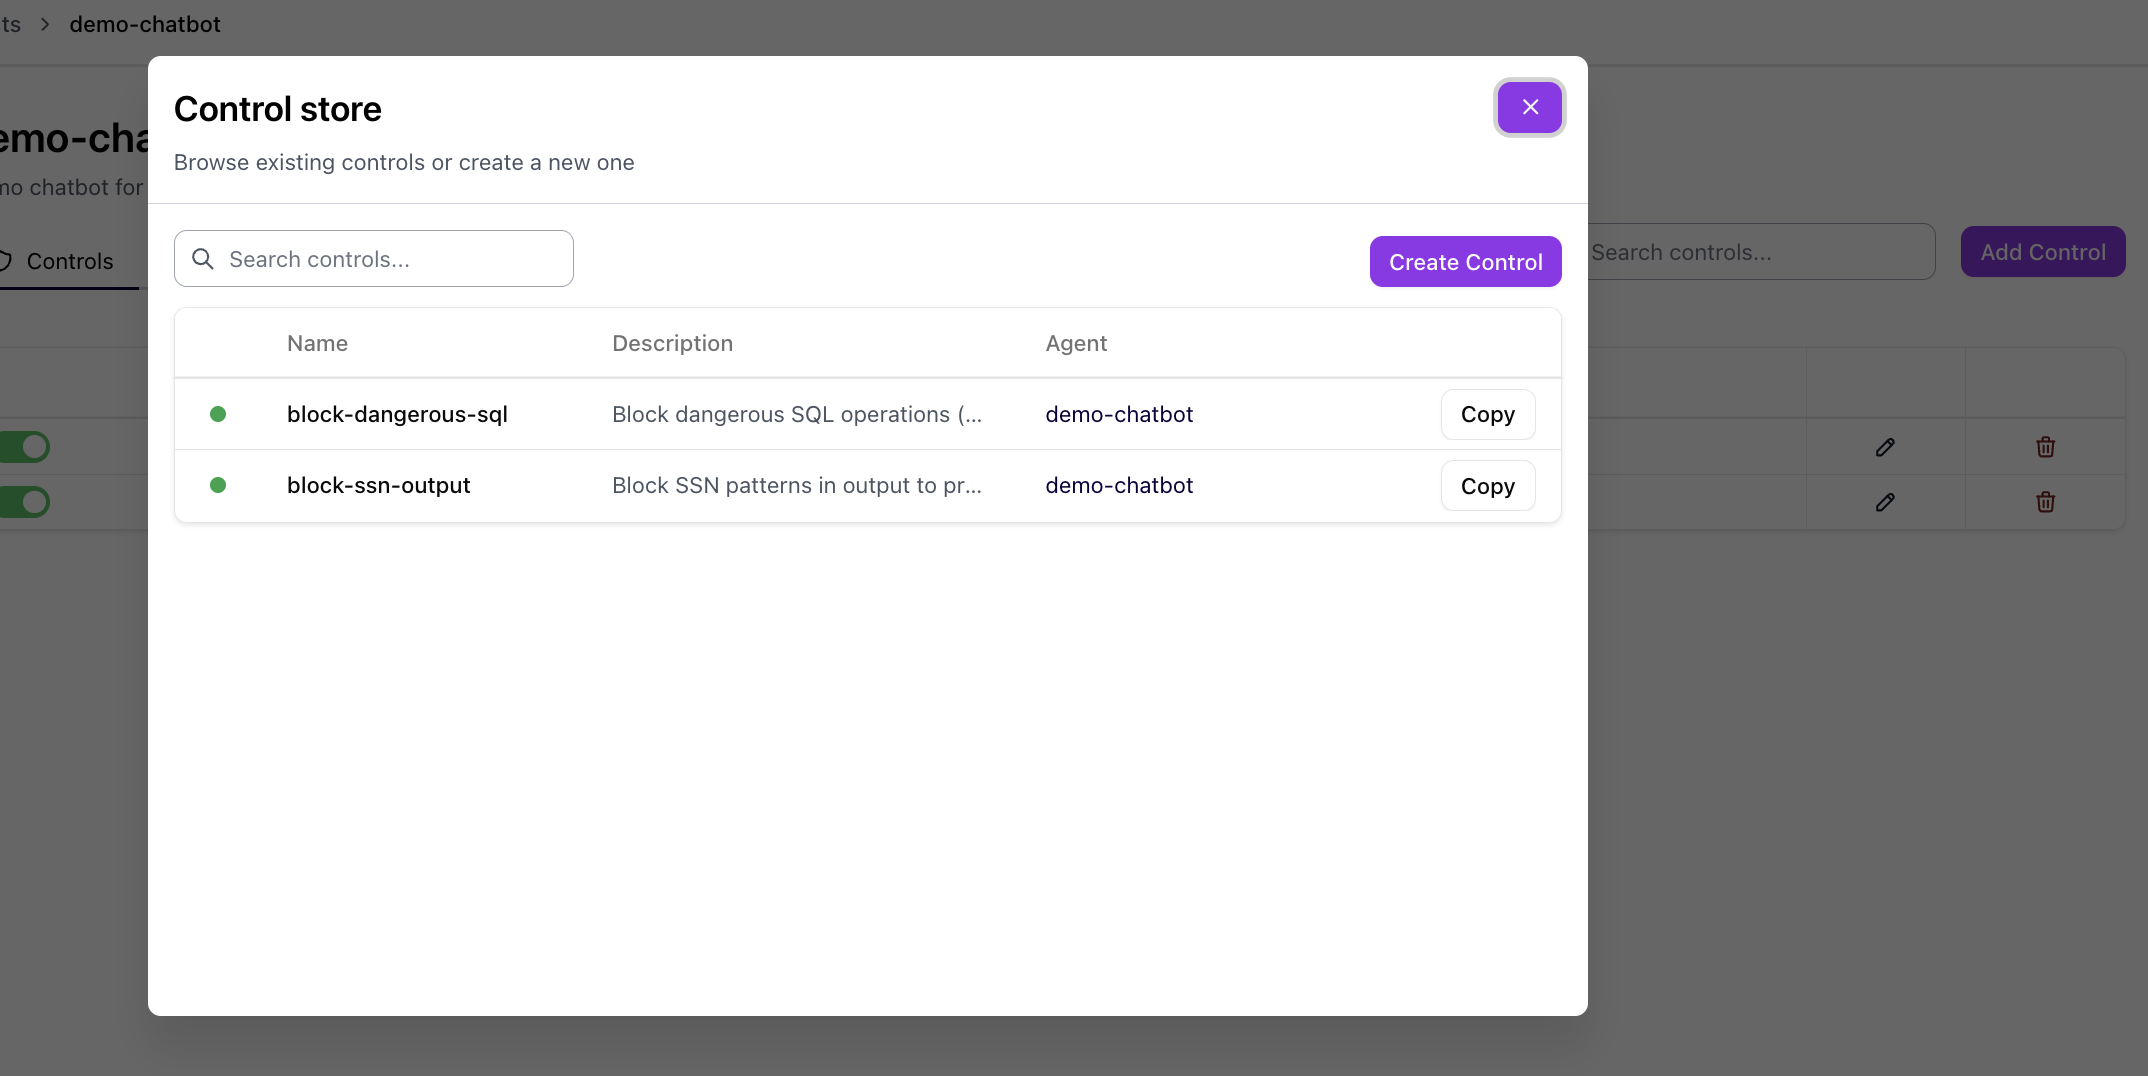
2
3
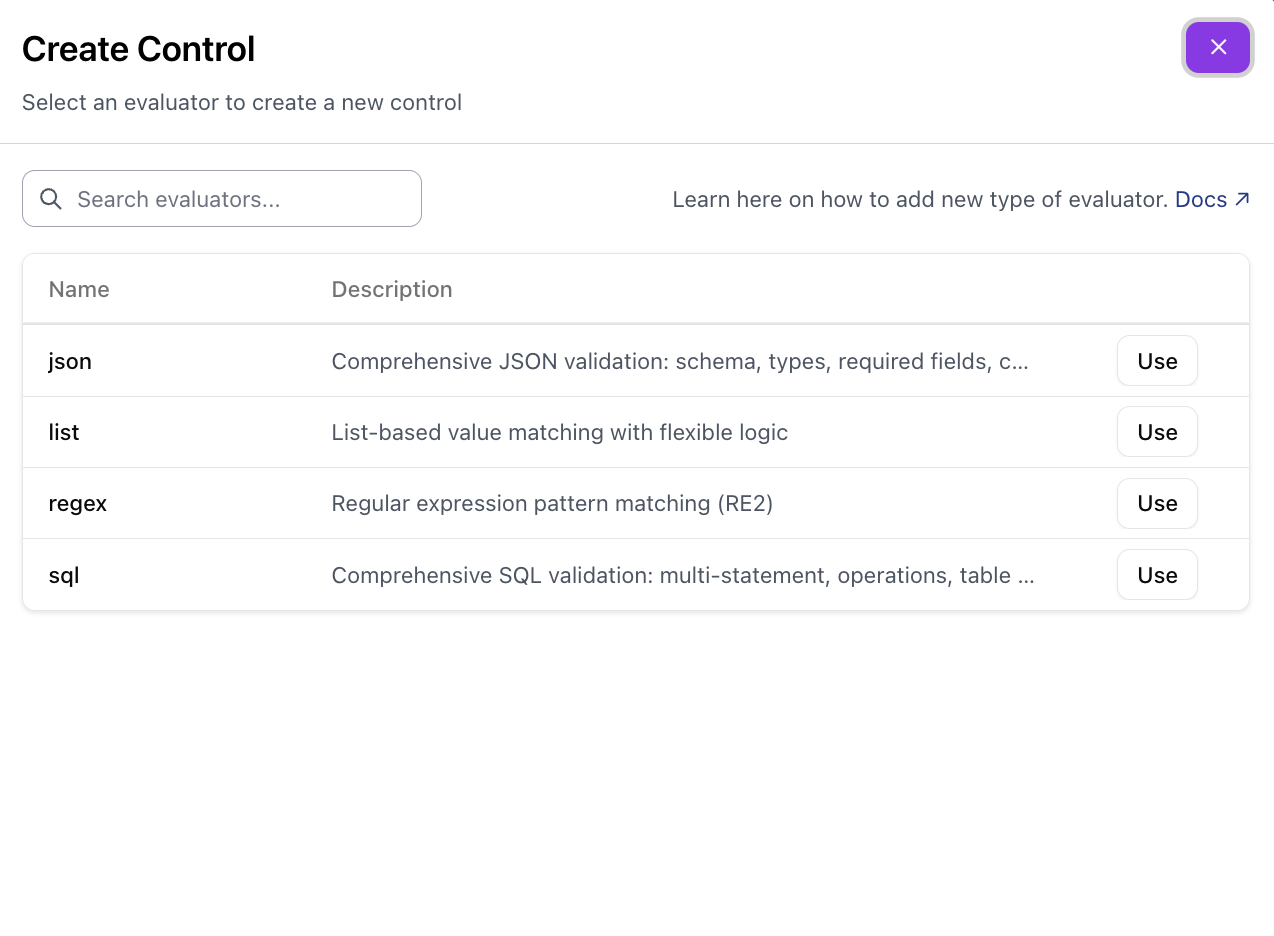
Configure the control
Fill in the control details. See Controls for a full explanation of each field.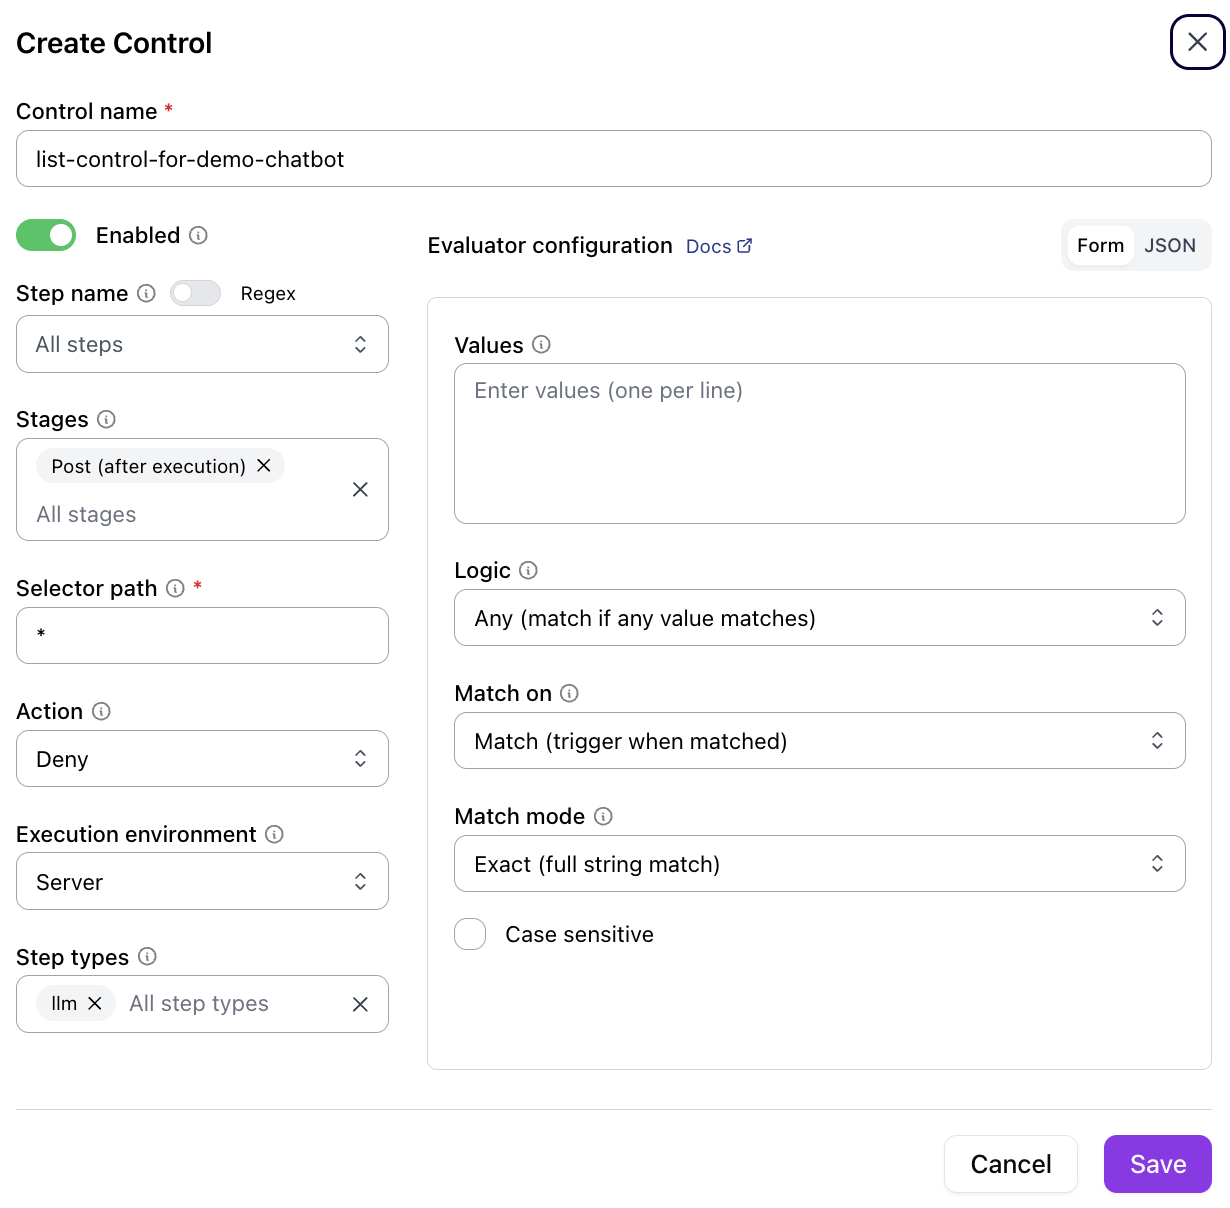
Click Save to register the control. It takes effect immediately — no redeployment needed.
Monitoring
The monitoring dashboard shows real-time control activity across all agents: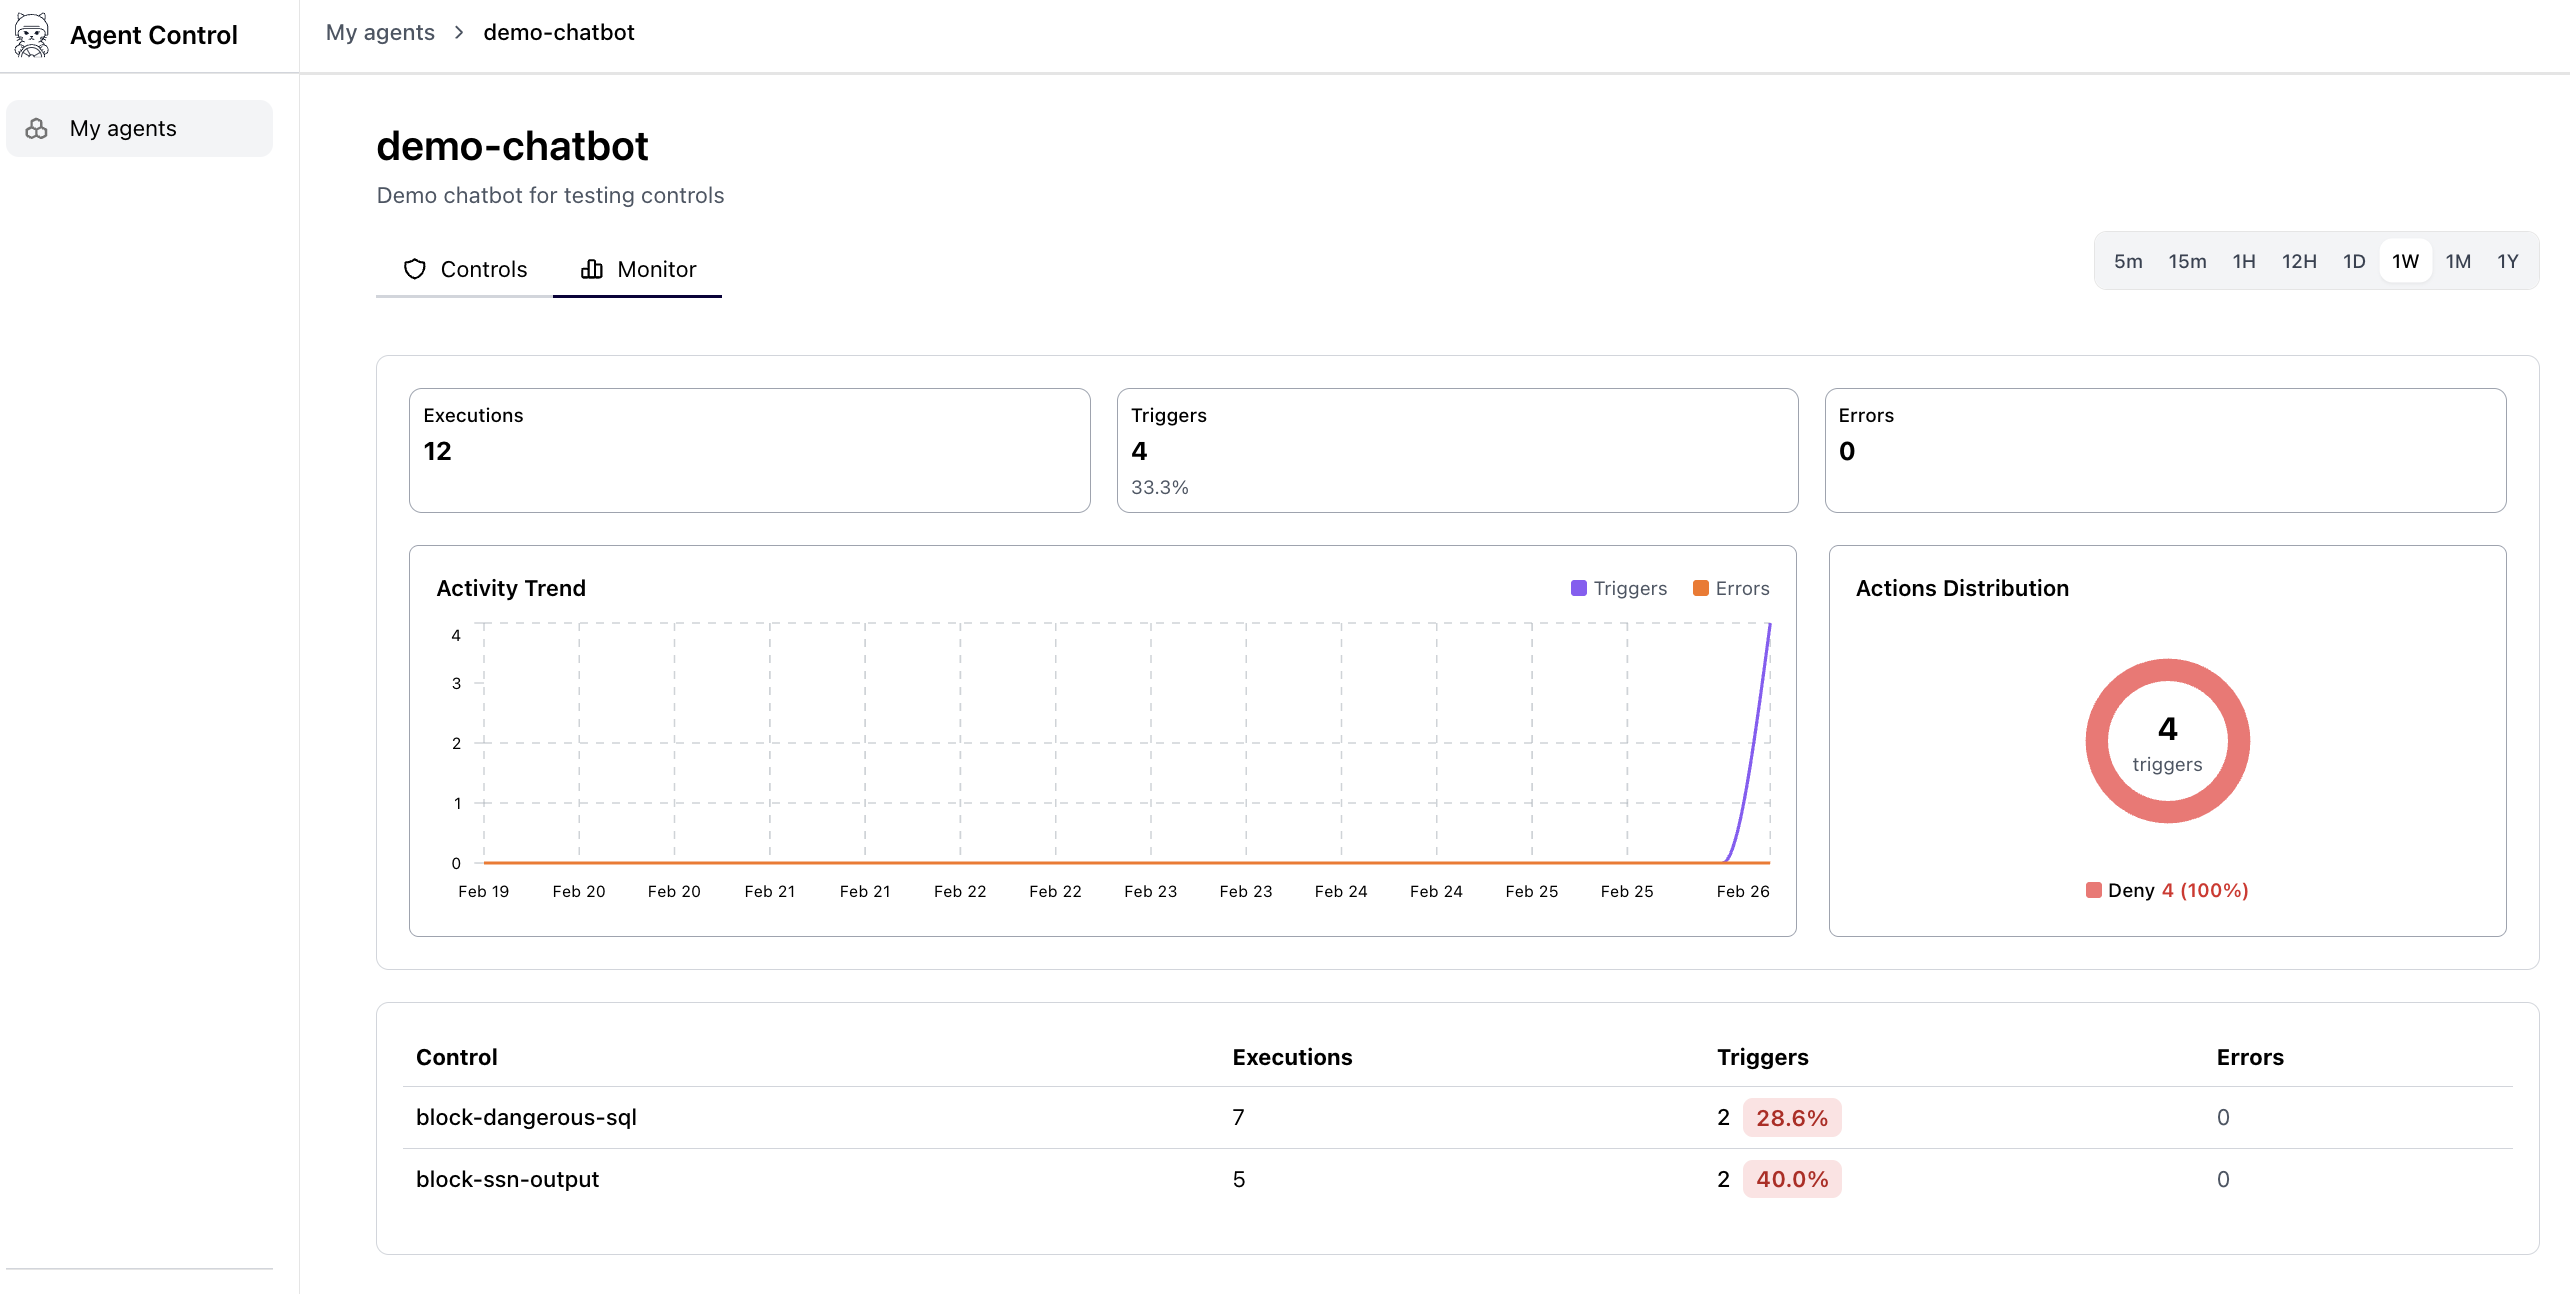
- Total evaluations — Requests processed per control
- Block count — Requests denied per control
- Pass/block ratio — Visual breakdown of allowed vs. blocked operations
- Activity timeline — Recent evaluations with timestamps
Monitoring data populates as agents process requests. Run the Agent Control Demo to generate sample data:
Next Steps
Agent Control Demo
Full end-to-end walkthrough with runnable scripts.
Controls
Learn how to define controls using the SDK or API.
Evaluators
Explore built-in and custom evaluator types.
Configuration
Server configuration, authentication, and deployment options.